statistics
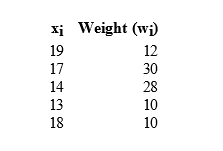
Question 1
- Compute the weighted mean for the following data.
Question 2
- If P(A) = 0.50, P(B) = 0.40, and P(A ∪ B) = 0.88, then P(B | A) =
Question 3
Six vitamin and three sugar tablets identical in appearance are in a box. One tablet is taken at random and given to Person A. A tablet is then selected and given to Person B. What is the probability that
- Person A was given a vitamin tablet?
- Person B was given a sugar tablet given that Person A was given a vitamin tablet?
- neither was given vitamin tablets?
- both were given vitamin tablets?
- exactly one person was given a vitamin tablet?
- Person A was given a sugar tablet and Person B was given a vitamin tablet?
- Person A was given a vitamin tablet and Person B was given a sugar tablet?
Question 1
Seventy percent of the students applying to a university are accepted. Using the binomial probability tables or Excel, what is the probability that among the next 18 applicants:
- At least 6 will be accepted?
- Exactly 10 will be accepted?
- Exactly 5 will be rejected?
- Fifteen or more will be accepted?
- Determine the expected number of acceptances.
- Compute the standard deviation.
Question 2
Scores on a recent national statistics exam were normally distributed with a mean of 80 and a standard deviation of 6.
- What is the probability that a randomly selected exam will have a score of at least 71?
- What percentage of exams will have scores between 89 and 92?
- If the top 2.5% of test scores receive merit awards, what is the lowest score eligible for an award?
For these project assignments throughout the course you will need to reference the data in the ROI Excel spreadheet. Download it here.
Using the ROI data set:
- For each of the 2 majors calculate the mean, median, minimum, maximum, range, and standard deviation for the columns ‘Cost’ and ’30-Year ROI’.
- By hand or with Excel, for each of the 2 majors calculate the probability that a college picked from the column for ‘School Type’ is ‘Private’.
- By hand or with Excel, for each of the 2 majors find the probability that a college with the ‘School Type’ ‘Private’ has a ’30-Year ROI’ between $1,500,000 and $1,800,000.
Using the ROI data set:
- If we select 7 colleges from a major and then record whether they are of ‘School Type’ ‘Private’ or not, is this experiment a binomial one? Why or why not?
- For each of the 2 majors determine if the ‘Annual % ROI’ appears to be normally distributed. Consider the shape of the histogram and the measures of central tendency (mean and median) to justify your results. Report on each of these with charts and calculations to justify your answers.
"You need a similar assignment done from scratch? Our qualified writers will help you with a guaranteed AI-free & plagiarism-free A+ quality paper, Confidentiality, Timely delivery & Livechat/phone Support.
Discount Code: CIPD30
Click ORDER NOW..
